Training on atmospheric dispersion in urban environments
8. Application of CUDM System to hypothetical scenarios in some Canadian cities
WINNIPEG
Downtown Winnipeg - Scenario 1: Animation of a simulated 15-minute street-level emission at Portage Avenue and Main Street.
The prevailing wind direction (red arrow) is from the northeast. The motion of particles clearly shows the recirculation in the wake of the tall building.
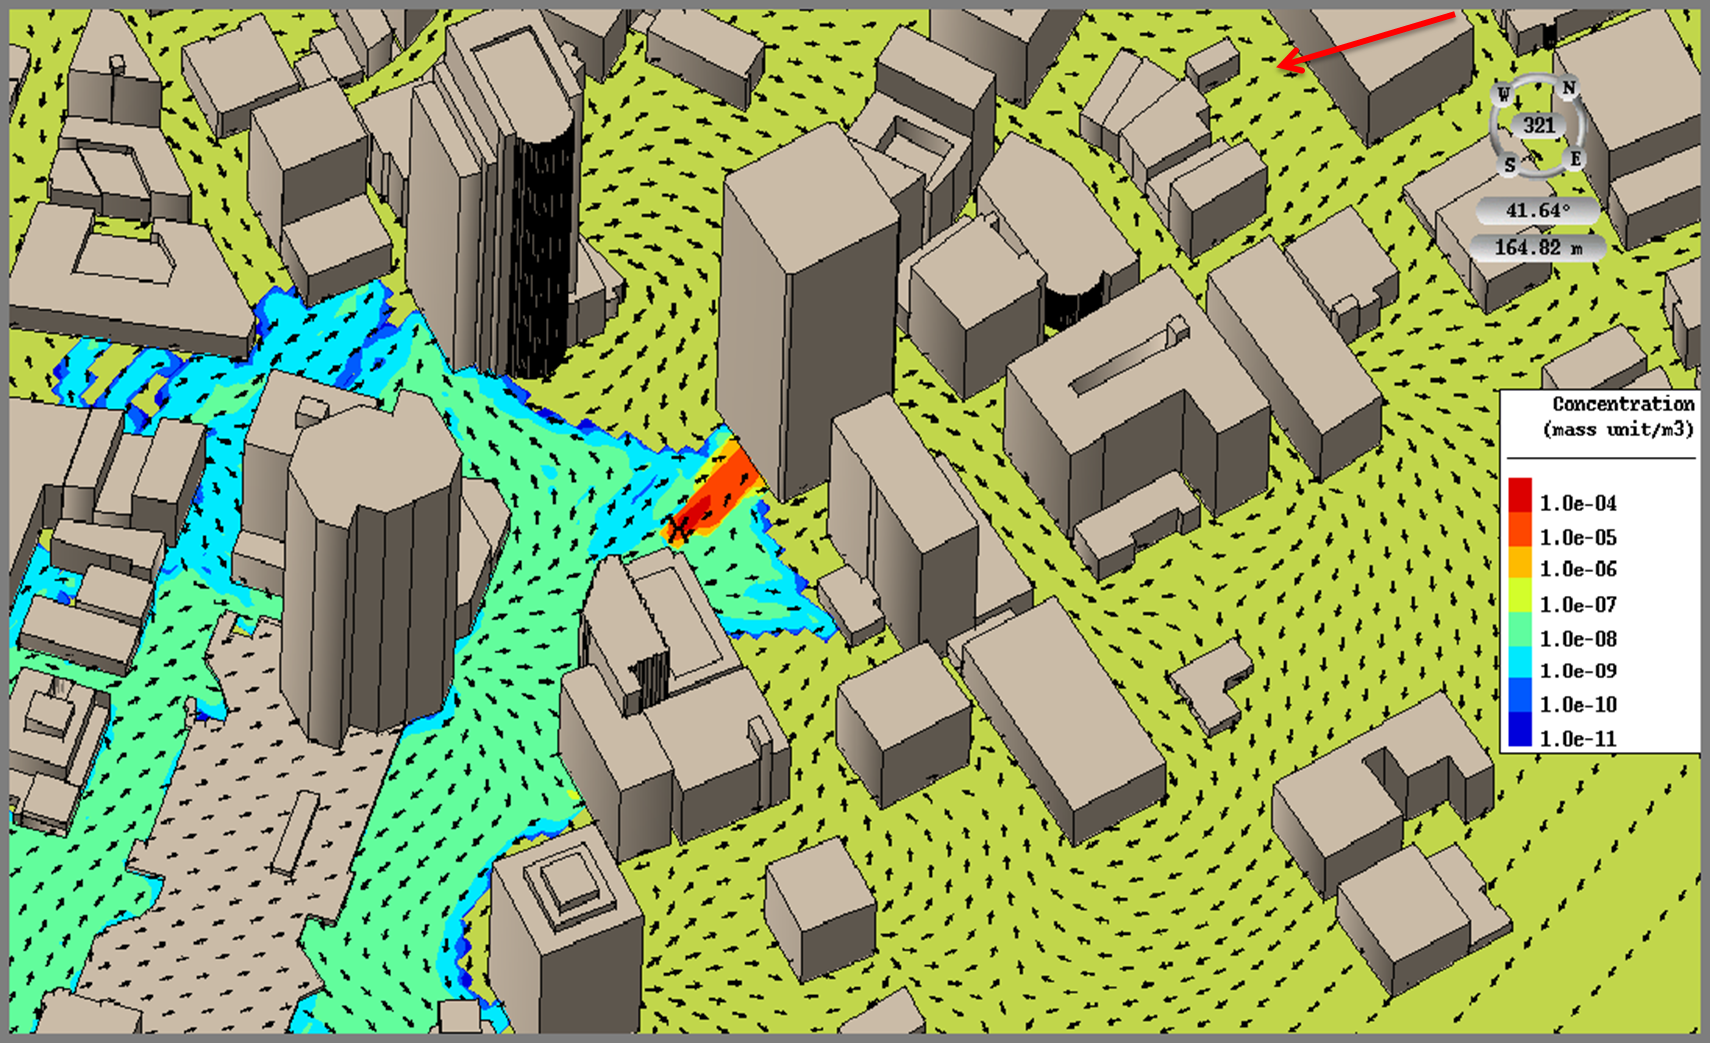
Downtown Winnipeg - Scenario 1: Street-level concentration for the same scenario as above, averaged over the duration of the simulation. The units are arbitrary, with warmer colours indicating higher relative concentrations, each colour level representing a change in concentrations by a factor of 10. Black arrows indicate wind direction at street level and the X symbol the location of the point source. Here, material from the release point is transported upstream in relation with the ambient wind due to the cavity flow, sidewall recirculation and channeling induced by the upwind buildings. Enlarge The figure
;)
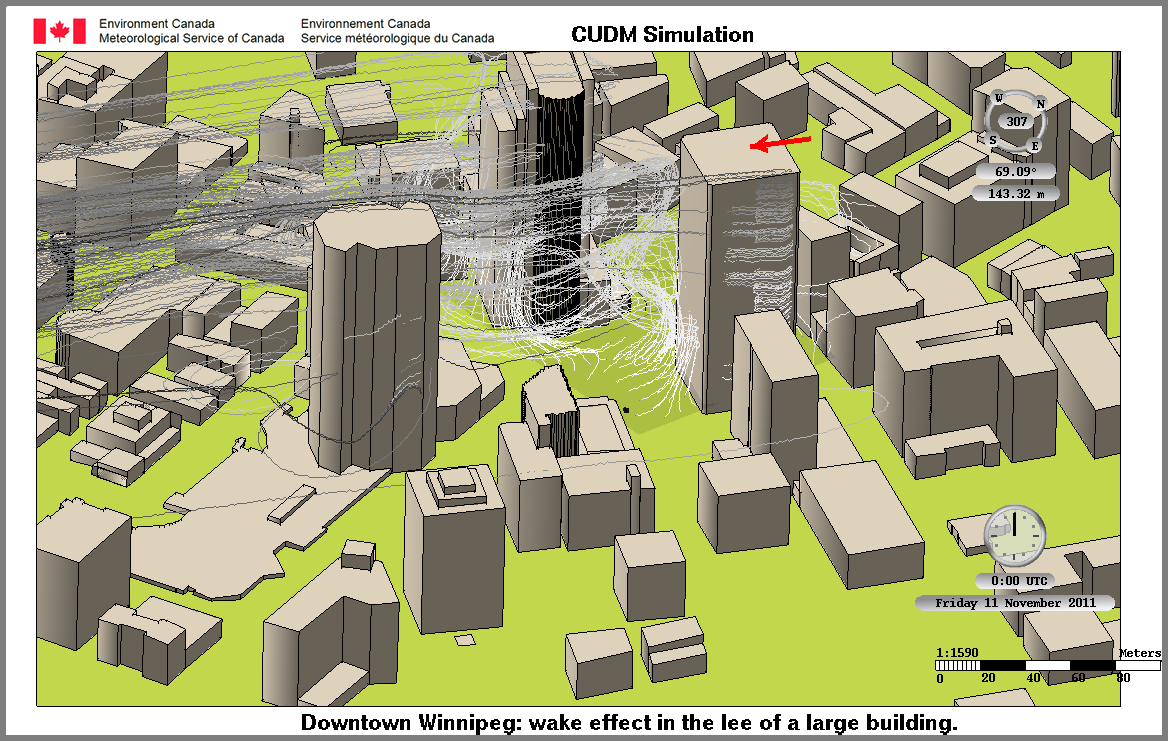
Downtown Winnipeg - Scenario 1: Cutaway of wind streamlines around the Richardson building. The red arrow indicates the direction of the prevailing (undisturbed) wind. Enlarge The figure
;)
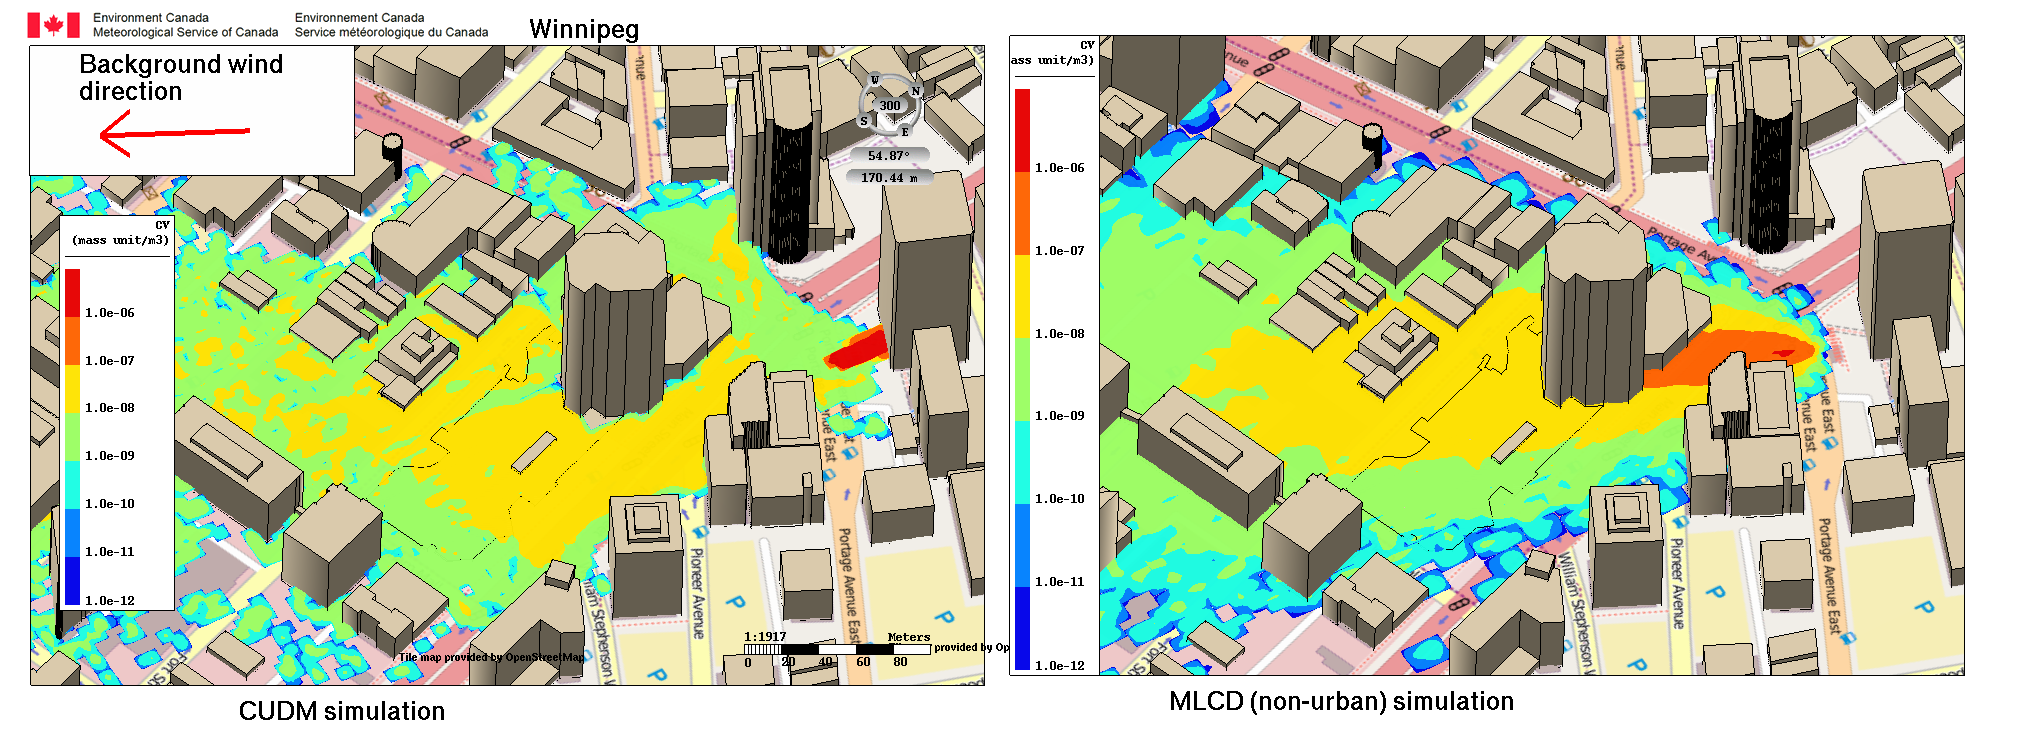
Downtown Winnipeg - Scenario 1: Comparison of the CUDM simulation (left) and the same scenario modeled by MLCD, a non-urban model (right). The location of the source is near Portage Avenue and Main Street. The deflection of the CUDM plume against the prevailing wind direction, and the transport upstream of the source location are in contrast to the plume of MLCD, which does not take into account the effect on the flow of buildings. This figure illustrates how material from the release point is transported upstream in relation to the ambient wind due to the cavity flow and by the sidewall recirculation of the upwind buildings. Enlarge The figure
<< Previous | >> Next;)