Training on atmospheric dispersion in urban environments
8. Application of CUDM System to hypothetical scenarios in some Canadian cities
Downtown Ottawa - Scenario 1: Animation of a simulated emitting vehicle moved northeastwards, against the background wind, along Queen Street between O'Connor and Metcalfe. The prevailing wind direction (red arrow) is from the northeast. Enlarge the animation.
;)
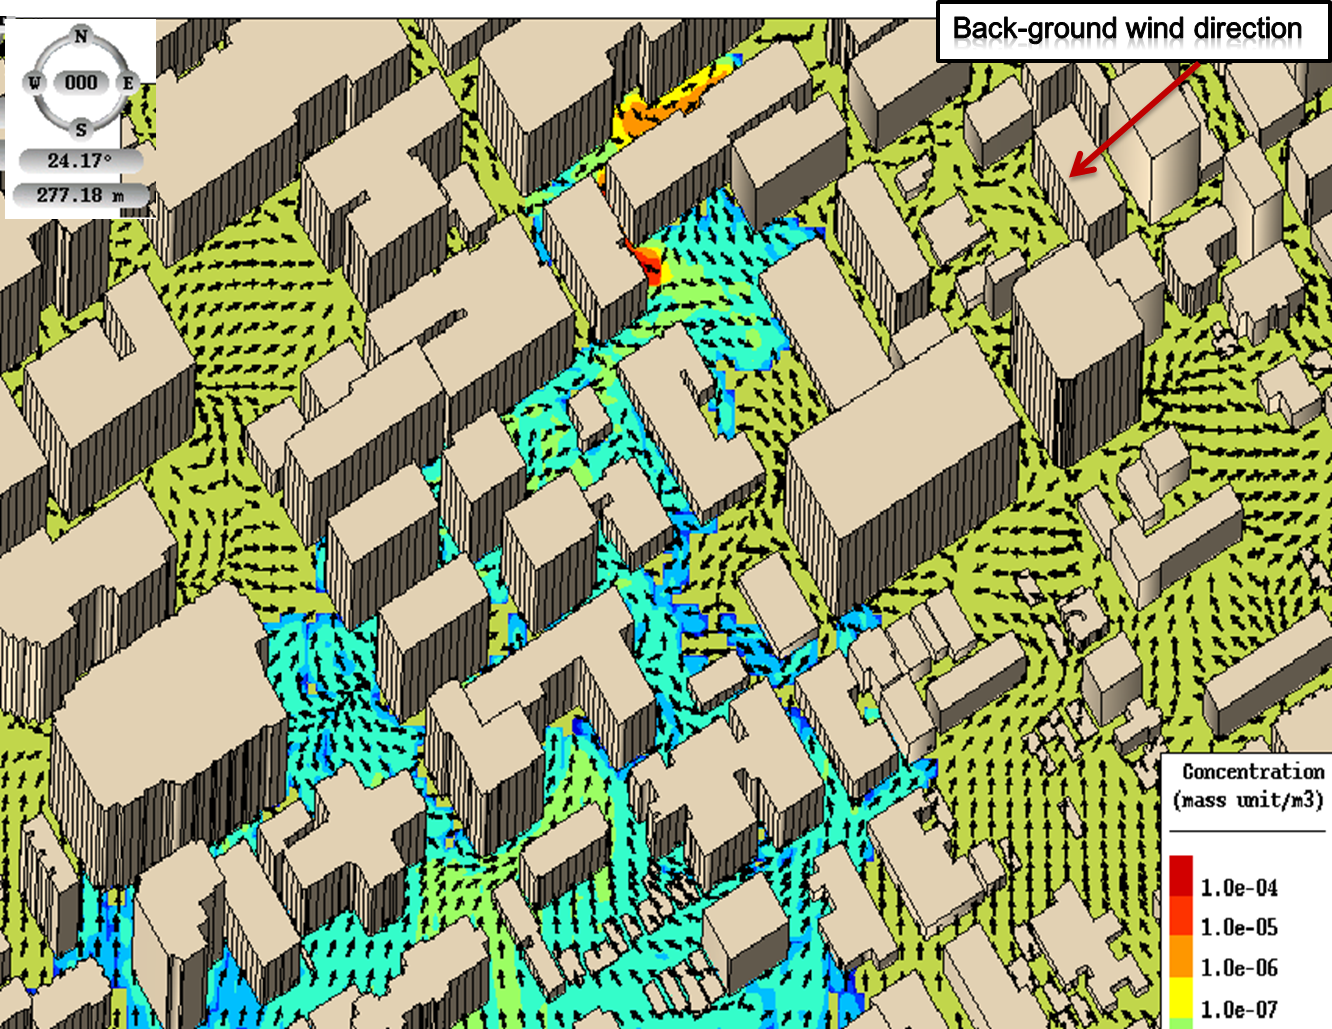
Downtown Ottawa - Scenario 2: Street-level concentration (30-minute average) resulting from a puff emission near the ground. The source is located at the corner of Bank and Slater Streets. Warmer colours indicate higher relative concentrations of dangerous material, with each colour level representing a change in concentration by a factor of 10. Black arrows show the wind direction at street level. The prevailing wind direction above the roof level is from the northeast (upper right). At the street level, winds are in all directions due to the impact of buildings, resulting in a deflection of the plume axis to a north-south orientation and a movement of the material released upstream of the source. Enlarge the figure.
;)
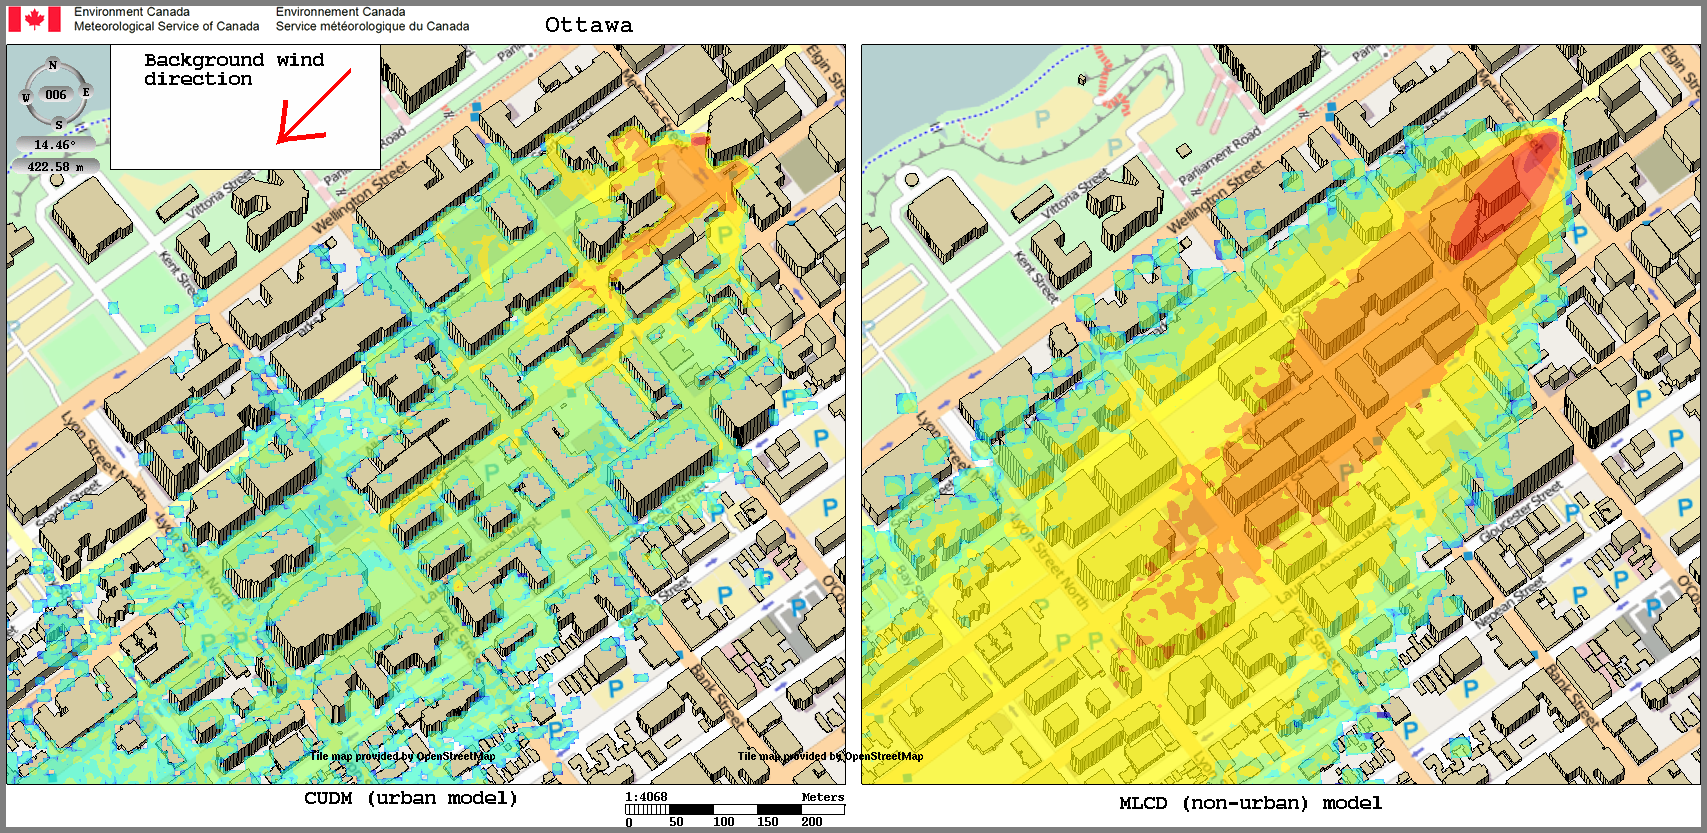
Downtown Ottawa - Scenario 3: Street-level concentration modeled from a puff emission at the northeast corner of Queen and Metcalfe Streets. Warmer colours indicate higher relative concentrations, with each colour level representing a change in concentration by a factor of 10. On the left, the average concentration as simulated by CUDM. On the right, the same scenario as simulated by the non-urban model MLCD. The recirculation and stagnation zones modeled by the CUDM system result in the higher concentrations remaining confined nearer to the source. In contrast, the MLCD model, which does not take buildings into account, spreads the material over a larger area. Enlarge the figure.
;)
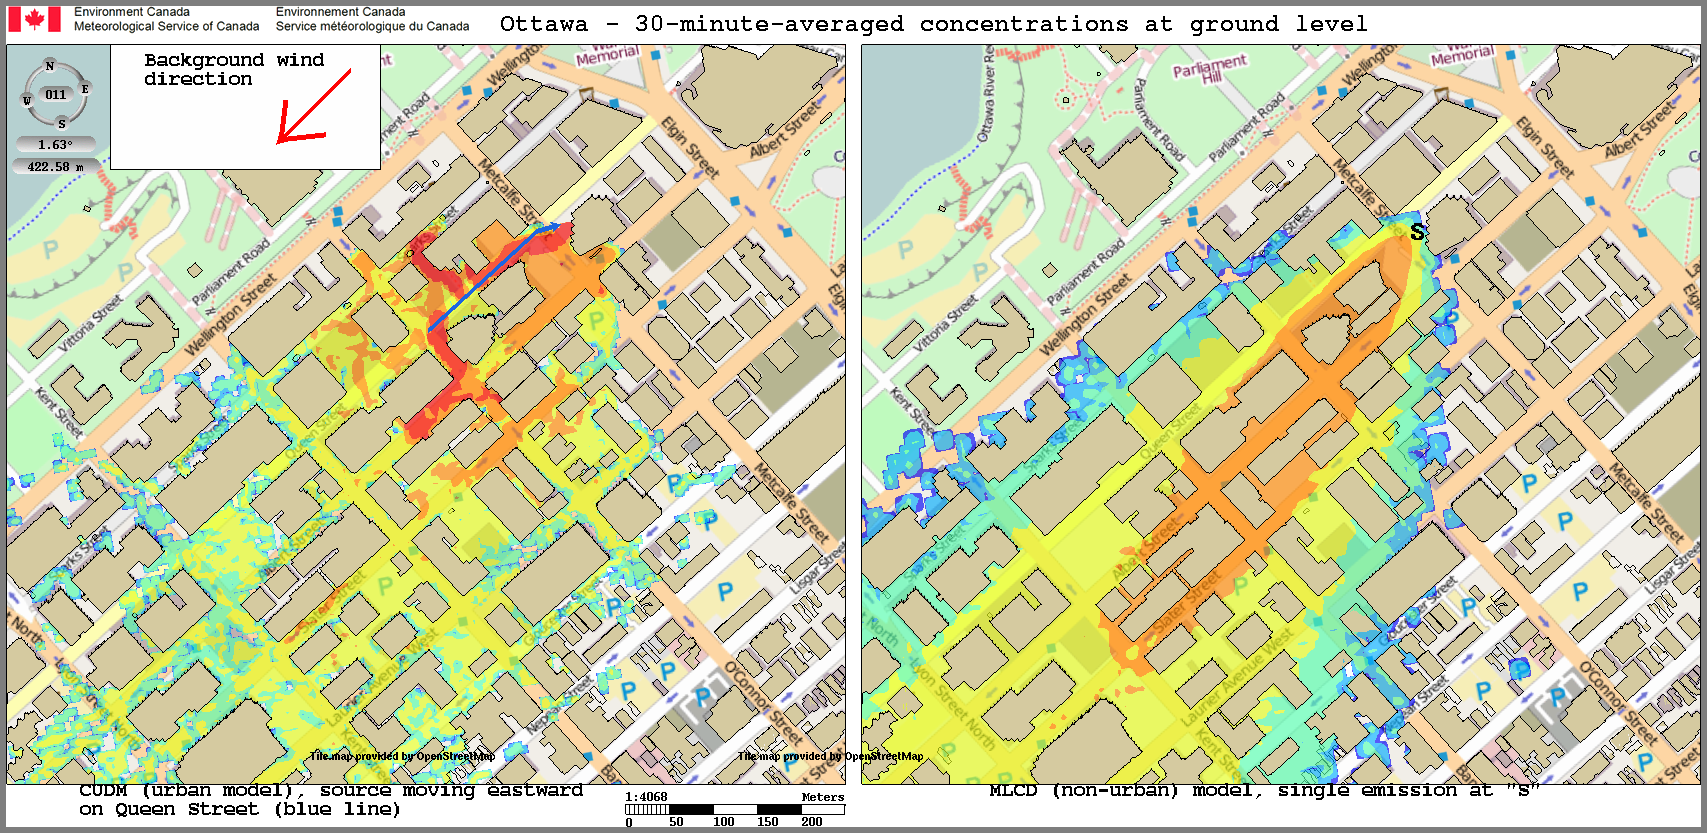
Downtown Ottawa - moving source - Scenario 1: Street-level concentrations, with warmer colours indicating higher relative concentrations, and each colour level representing a change in concentrations by a factor of 10. An emitting vehicle moved northeastward, against the background wind, along Queen Street between O'Connor and Metcalfe. On the left, the blue line shows the vehicle's path. The CUDM system is able to simulate the moving emitter as a series of discrete puffs along the street. Street level deflections of the wind cause the material to be carried away from the centerline of the background wind. On the right, the non-urban MLCD model can simulate a single emitter position, in this case the final position of the vehicle. Enlarge the figure.
<< Previous | >> Next;)