Training on atmospheric dispersion in urban environments
8. Application of the CUDM System to hypothetical scenarios in some Canadian cities
TORONTO
Downtown Toronto - Scenario 1: Animation of a CUDM simulation. The street-level emission, lasting 15 minutes,
is simulated by a release of 100,000 particles. The recirculation against the building beside the emission causes the material to initially
move opposite to the prevailing south-southwesterly wind direction.
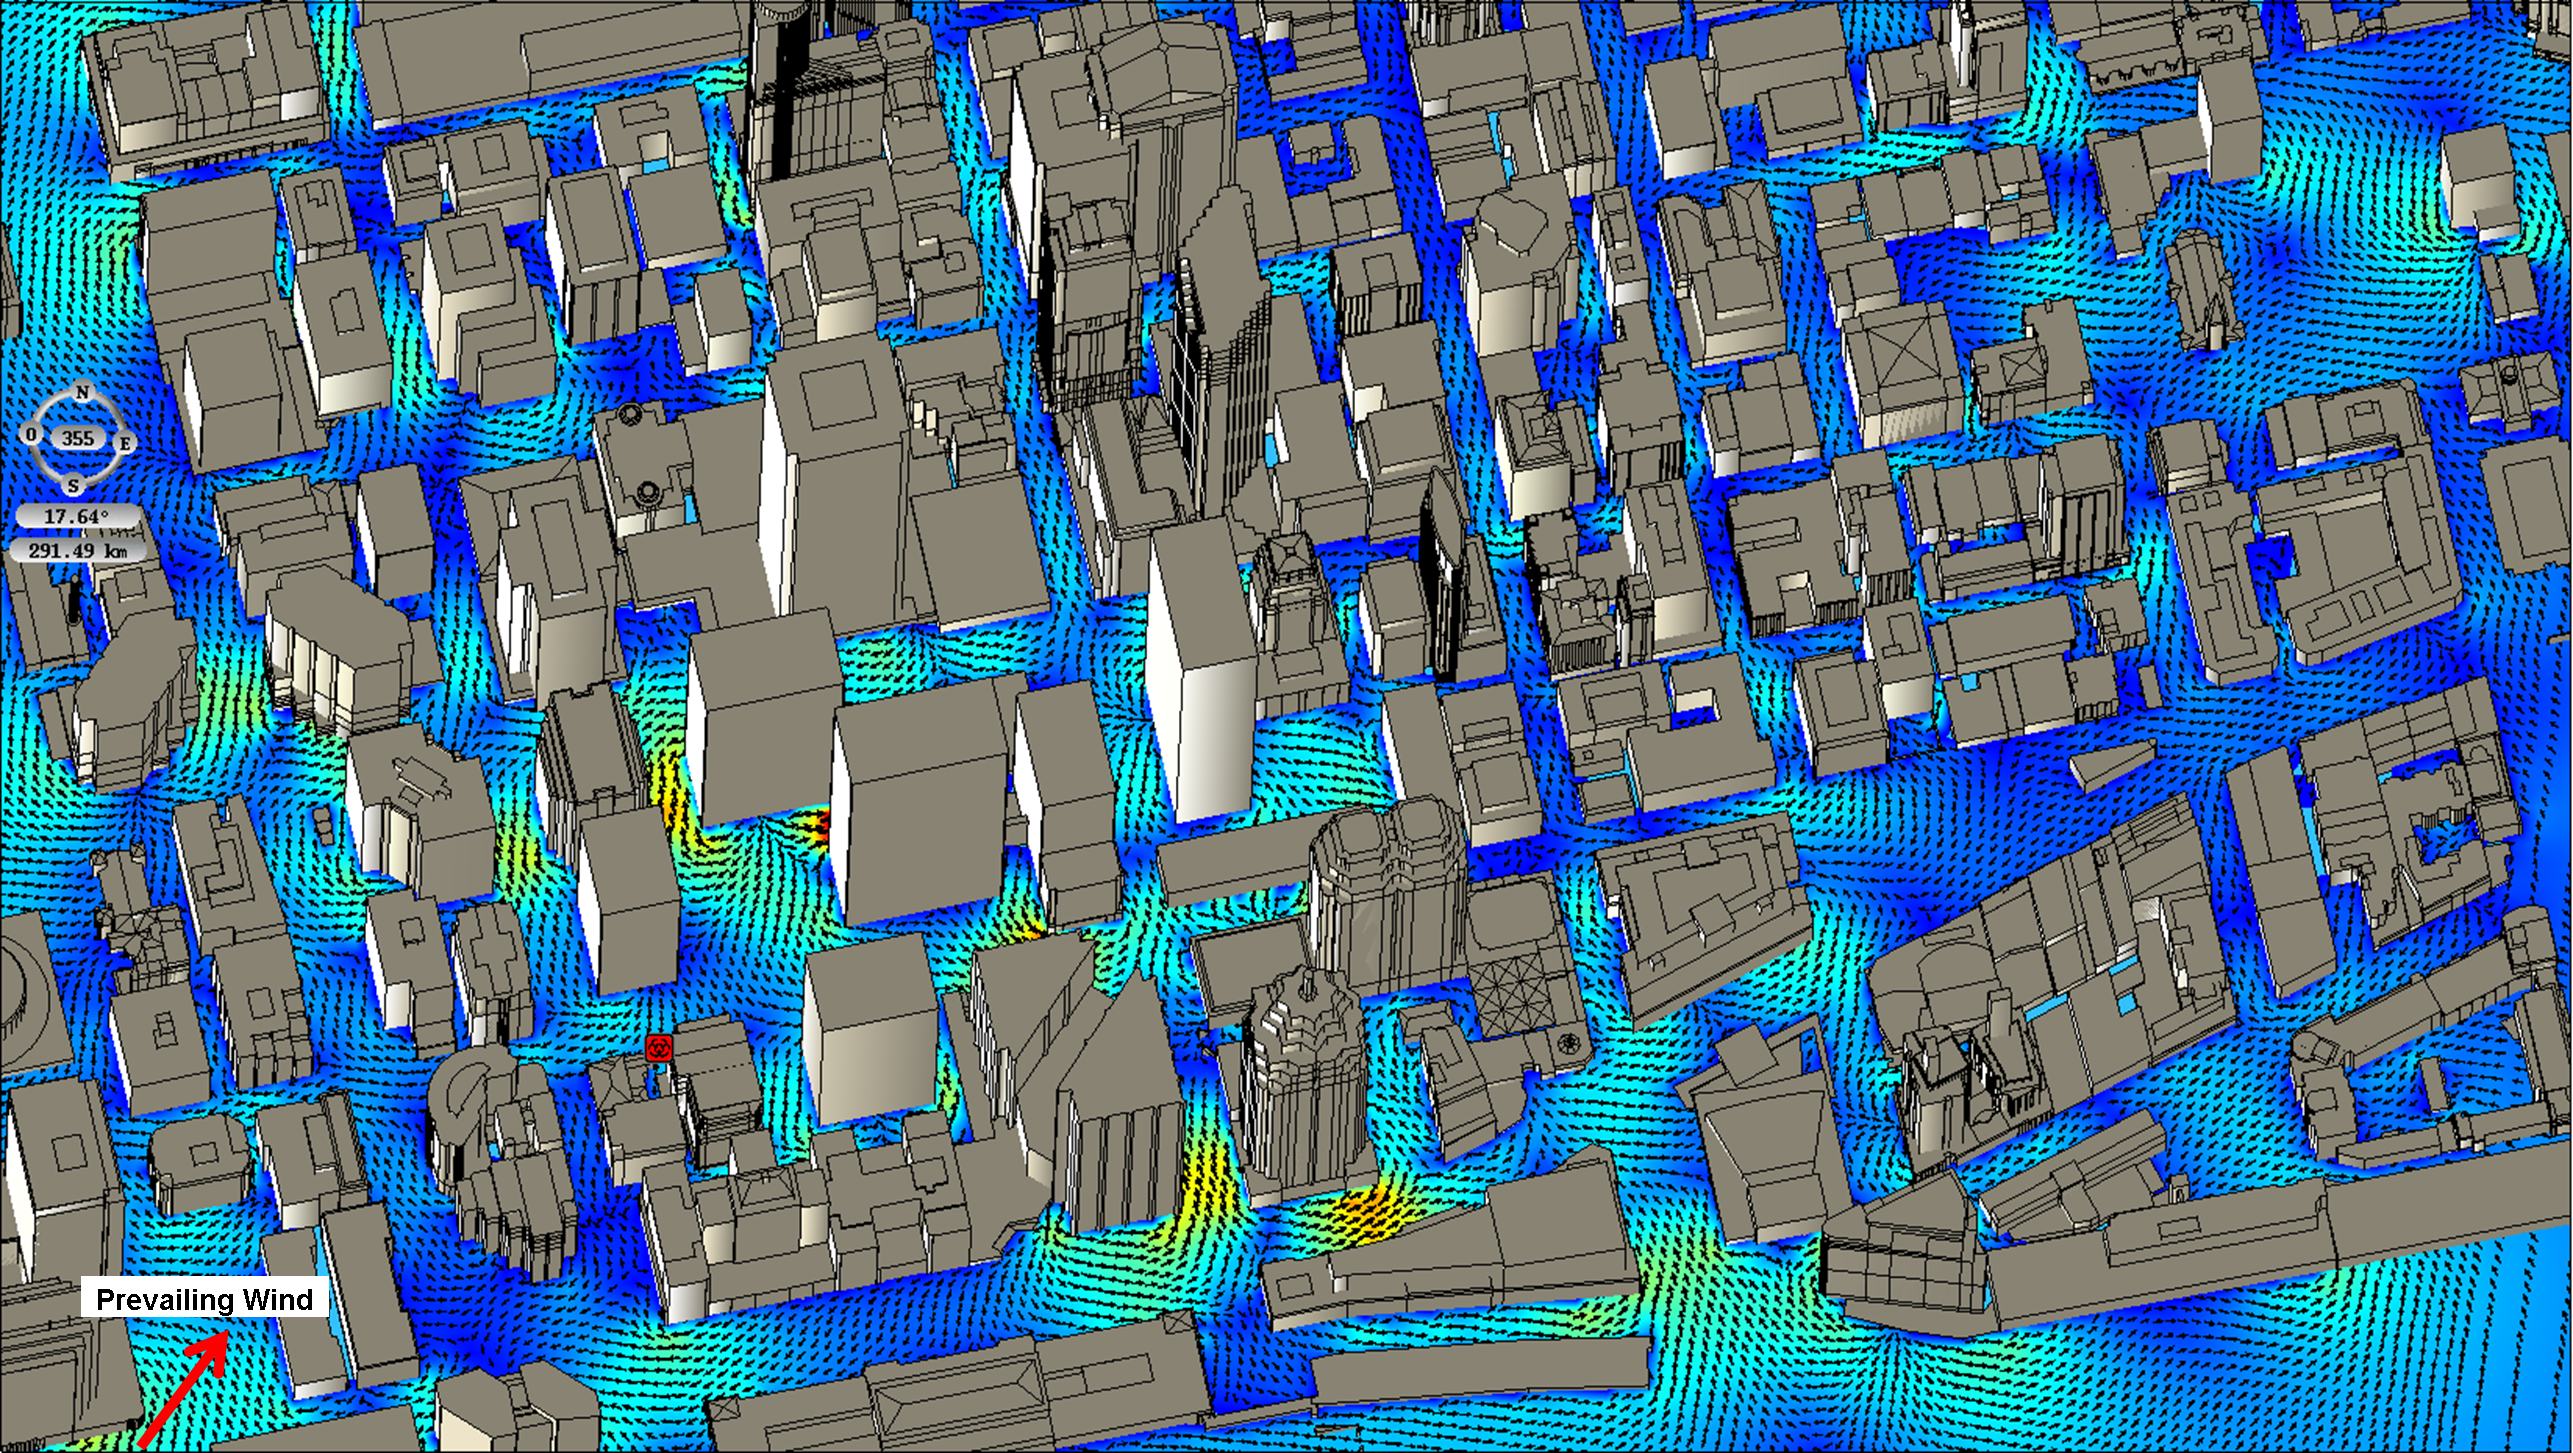
Downtown Toronto - Scenario 1: Street level wind (black arrows) for the same scenario. The prevailing wind is SSW at 220 degrees. The red symbol indicates the location of the release source. The colors represent the wind strength. Due to the deflection of flow by the tall buildings, the direction of the wind at ground level can be opposite to what is expected. Enlarge the figure
;)
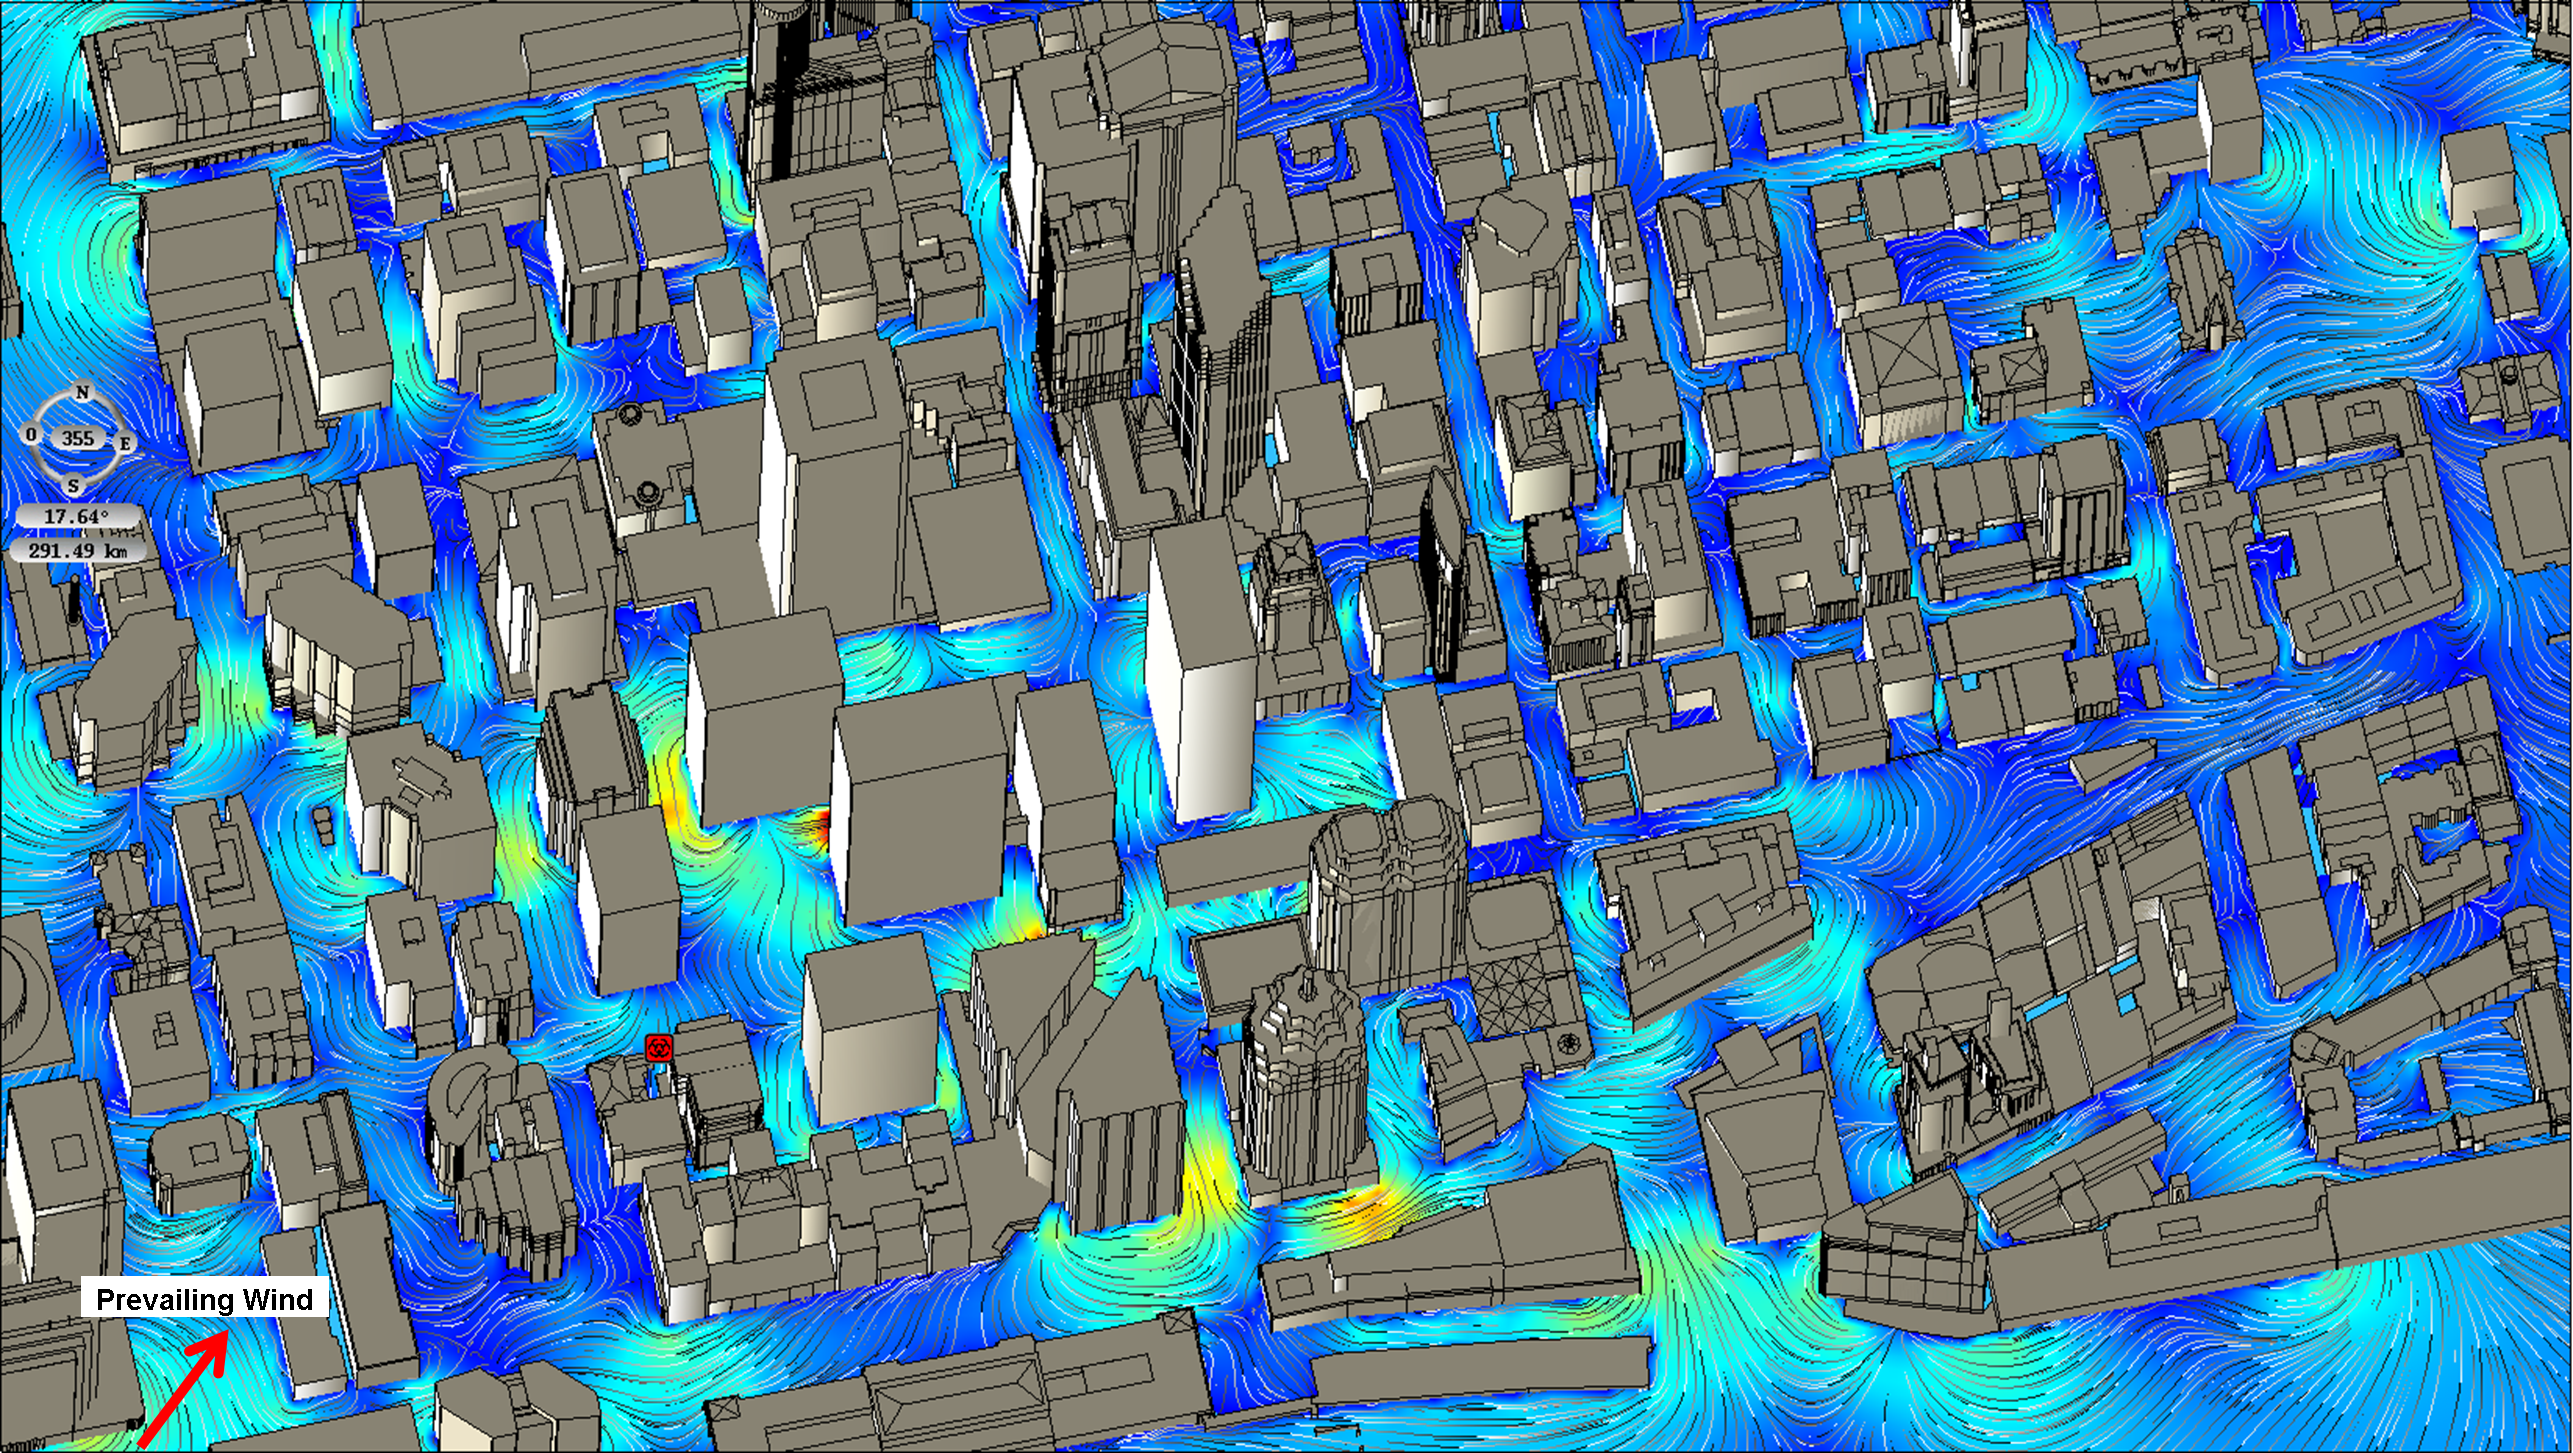
Downtown Toronto - Scenario 1: Street-level streamlines of the flow, for the same scenario. The colors represent the wind strength. Enlarge the figure
;)
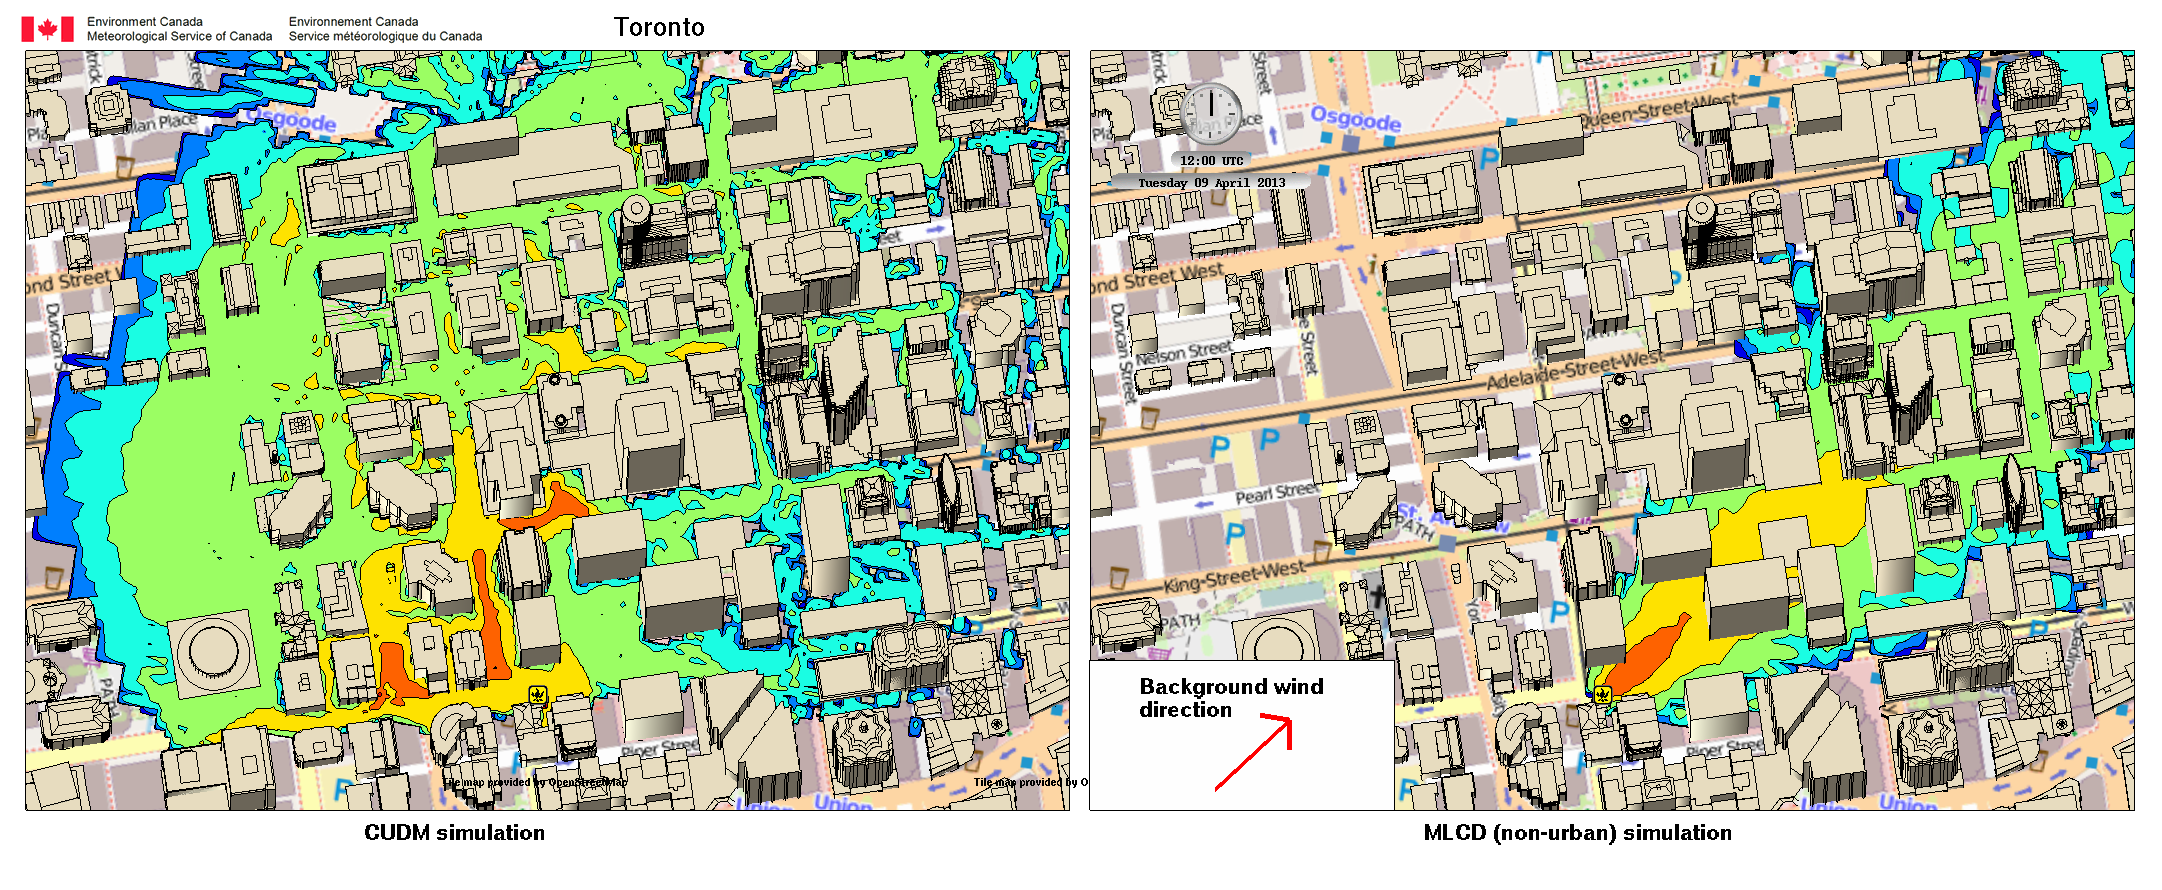
Downtown Toronto - Scenario 1: Comparison of the CUDM simulation (left) and the same scenario modeled by MLCD, a non-urban model (right). The yellow symbol indicates the location of the source, near Wellington and York Streets. Warmer colours indicate higher relative concentrations of dangerous material, with each colour level representing a change in concentrations by a factor of 10.The deflection of the CUDM plume against the prevailing wind direction, and the greater width from lateral dispersion along side streets, is in contrast to the plume of MLCD, which does not take into account the effect on the flow of buildings. This figure illustrates how initial lateral plume spread is greatly enhanced. Enlarge the figure.
;)
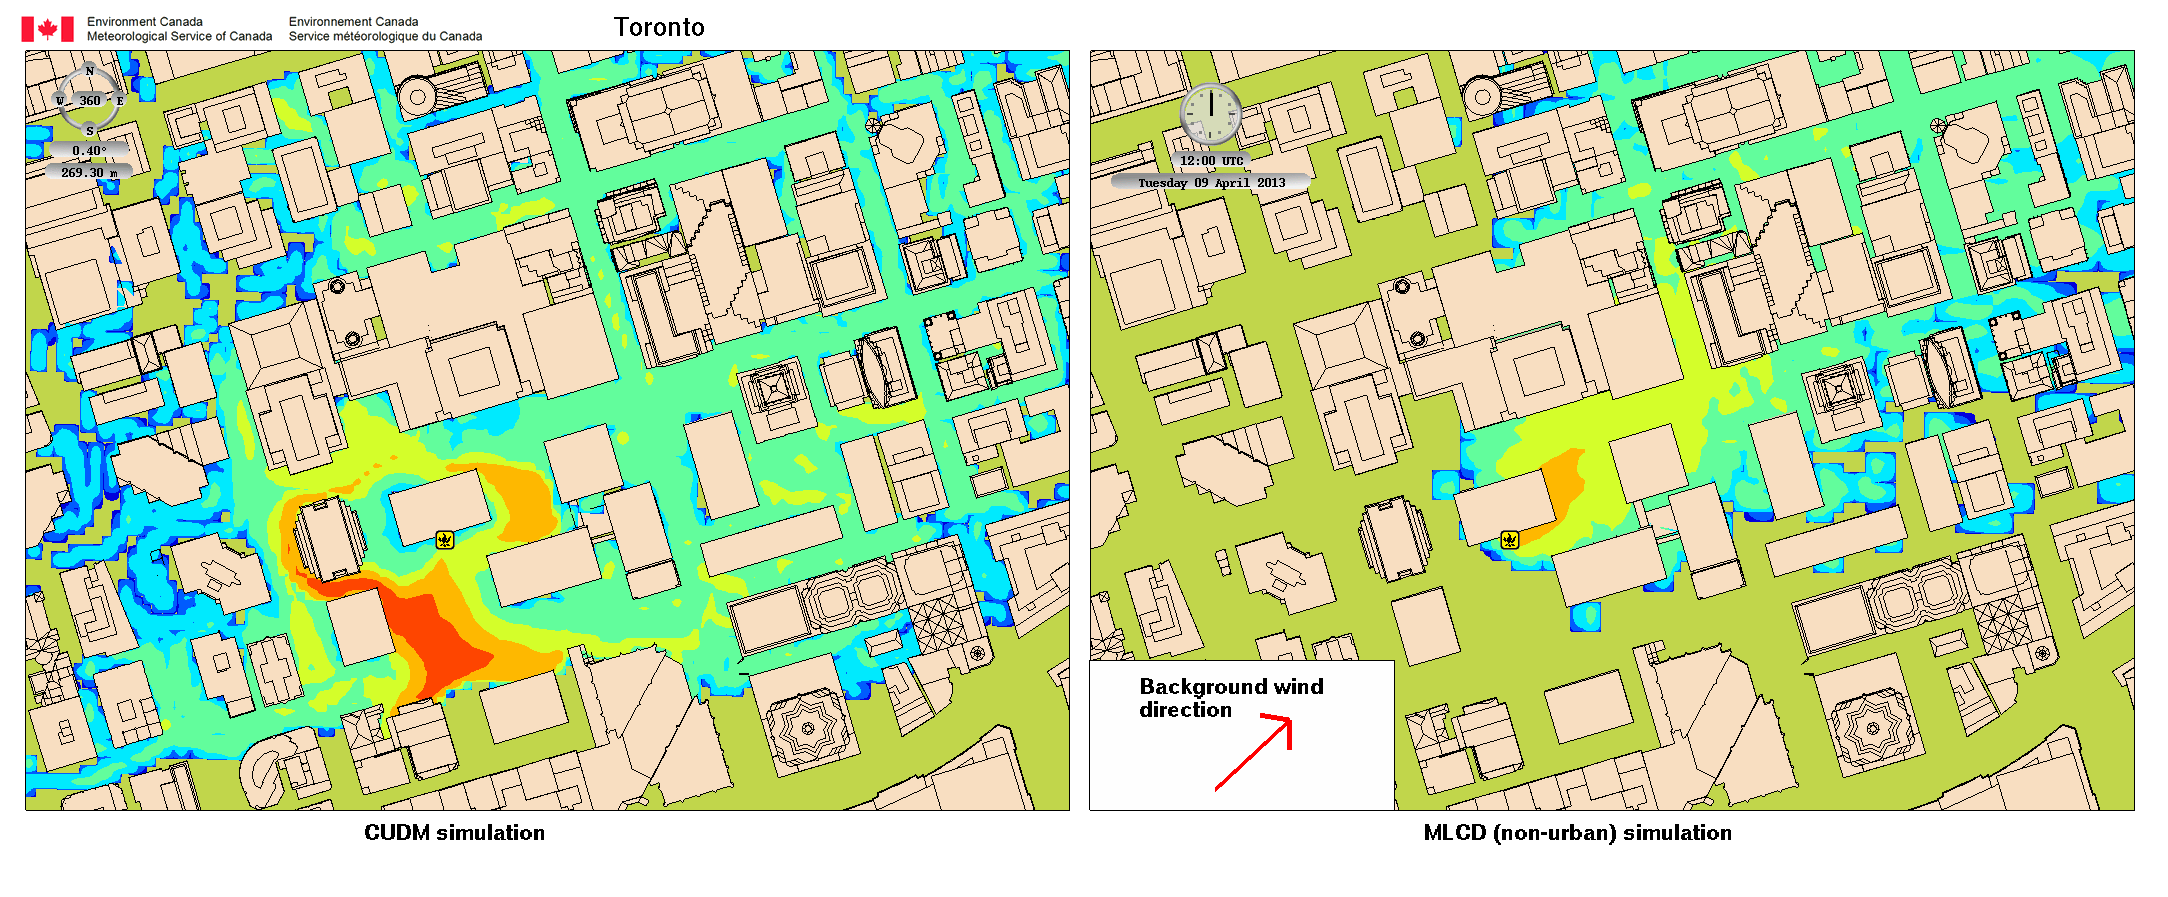
Downtown Toronto - Scenario 2: Comparison of the CUDM simulation (left) and the same scenario modeled by MLCD, a non-urban model (right). The yellow symbol indicates the location of the source, near Toronto-Dominion Centre. Warmer colours indicate higher relative concentrations of dangerous material, with each colour level representing a change in concentrations by a factor of 10. The deflection of the CUDM plume against the prevailing wind direction, the greater width from lateral dispersion along side streets, and the transport upstream of the source location are in contrast to the plume of MLCD, which does not take into account the effect on the flow of buildings. This figure illustrates how the initial lateral plume spread is greatly enhanced and how material from the release point is transported upstream in relation to the ambient wind due to the cavity flow, sidewall recirculation and channeling induced by the upwind buildings. Enlarge the figure.
;)
From these figures we learn that in some cases, contaminated areas and potentially exposed population can be dramatically changed by upstream transport. Dispersion models that do not account for these near-source effects could provide misleading information if applied in cities.
<< Previous | >> Next